Data visualization
The goal of data visualization is to enable the user to engage with the data through good and clear visualization. But how do you present data in a way that is meaningful and engaging? We transform complex data into visualizations that are both informative and inspiring.

Data visualization
"Large amounts of data, for instance, are made clear in dashboards. But beyond dashboards, there are many more ways to make data understandable. Consider an infographic of an annual report, one that visualizes website usage in a staff magazine, or the actions people take in an online portal.
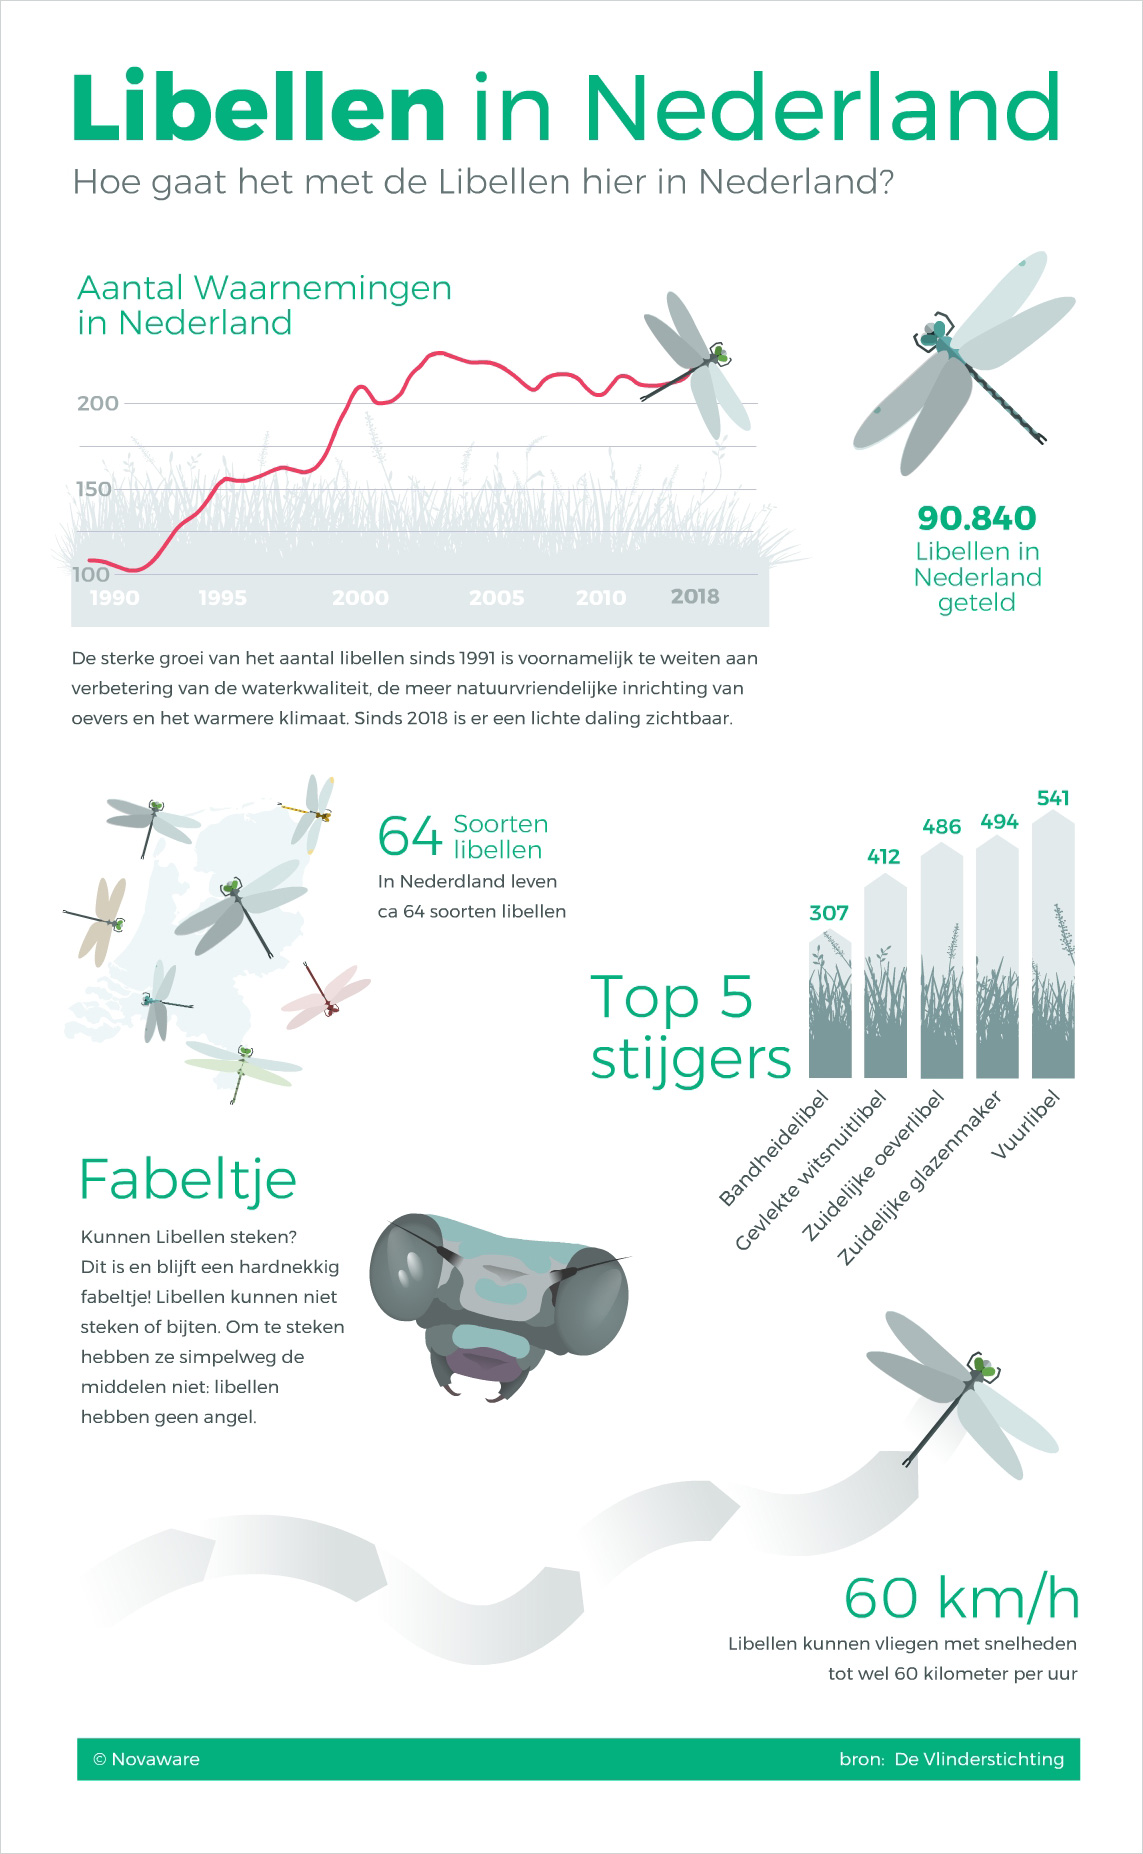
Below, you see an example of an infographic using a data set from the Butterfly Foundation. This form of making data visually accessible is also exceptionally well-suited for animation.